Toronto and Etobicoke Real Estate Homes Sales for April 2017

Looking for current information on Toronto and Etobicoke Real Estate Home Sales for April 2017?
Strong Growth in New Listings in April
Toronto Real Estate Board President Larry Cerqua announced that Greater Toronto Area REALTORS® entered 33.6 per cent more new listings into TREB’s MLS® System in April 2017, at 21,630, compared to the same month in 2016. New listings were up by double-digits for all low-rise home types, including detached and semi-detached houses and townhouses. New listings for condominium apartments were at the same level as last year.
Total sales for the TREB market area as a whole amounted to 11,630 – down 3.2 per cent year-over-year. One issue underlying this decline was the fact that Easter fell in April in 2017 versus March in 2016, which resulted in fewer working days this year compared to last and, historically, most sales are entered into TREB’s MLS® System on working days.
“The fact that we experienced extremely strong growth in new listings in April means that buyers benefitted from considerably more choice in the marketplace. It is too early to tell whether the increase in new listings was simply due to households reacting to the strong double-digit price growth reported over the past year or if some of the increase was also a reaction to the Ontario government’s recently announced Fair Housing Plan,” said Mr. Cerqua. The MLS® Home Price Index (HPI) Composite Benchmark Price was up by 31.7 per cent year over- year in April 2017. Similarly, the average selling price for all home types combined was up by 24.5 per cent to $920,791.
“It was encouraging to see a very strong year-over-year increase in new listings. If new listings growth continues to outpace sales growth moving forward, we will start to see more balanced market conditions. It will likely take a number of months to unwind the substantial pent-up demand that has built over the past two years. Expect annual rates of price growth to remain well-above the rate of inflation as we move through the spring and summer months,” said Jason Mercer, TREB’s Director of Market Analysis.
But that is only a snapshot of what happened in the GTA. If you are looking for Etobicoke Real Estate Home Sale stats for your local area, I have you covered.
Here is a snapshot of homes sold in the month of April for Etobicoke:
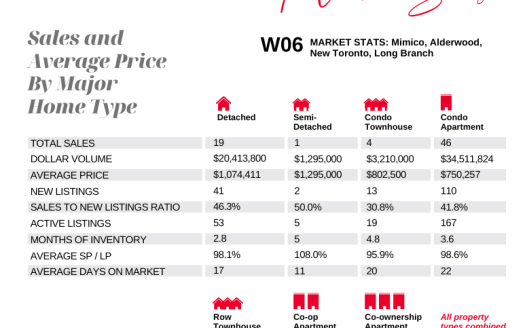
ETOBICOKE REAL ESTATE MARKET WATCH
| District | Active | Sold/Month | Sold/Year | Average$/Month |
|---|---|---|---|---|
| Area Total: | 447 | 458 | 1433 | |
| W06 | 205 | 210 | 645 | $617,270 |
| W07 | 32 | 33 | 101 | $1,228,131 |
| W08 | 210 | 215 | 687 | $953,266 |
How did your Etobicoke market do? Do you have questions about your Etobicoke home and wonder where it falls within theses stats?
For more detailed information on your Etobicoke neighbourhood or more specifically on your own home. I invite you to give me a call at 416-762-8255 or e-mail me today
PART OF MY JOB AS YOUR REALTOR® IS TO PROVIDE YOU WITH UP TO DATE LOCAL MARKET STATISTICS. THIS WAY YOU ARE KEPT IN THE KNOW ABOUT YOUR HOME’S WORTH.
THIS INFORMATION IS CRITICAL FOR MAKING A DECISION IF YOU ARE THINKING ABOUT WHETHER NOW IS A GOOD TIME TO SELL, BUY OR JUST ENJOY YOUR HOME FOR MANY YEARS TO COME!