Toronto and Etobicoke Real Estate Homes Sales for August 2017

Looking for current information on Toronto and Etobicoke Real Estate Home Sales for August 2017?
GTA REALTORS® Release August Stats
Toronto Real Estate Board President Tim Syrianos announced that Greater Toronto Area REALTORS® reported 6,357 home sales through TREB’s MLS® System in August 2017. This result was down by 34.8 per cent compared to August 2016.
The number of new listings entered into TREB’s MLS® System, at 11,523, was down by 6.7 per cent year-over-year and was at the lowest level for August since 2010.
“Recent reports suggest that economic conditions remain strong in the GTA. Positive economic news coupled with the slower pace of price growth we are now experiencing could prompt an improvement in the demand for ownership housing, over and above the regular seasonal bump, as we move through the fall,” continued Mr. Syrianos.
The average selling price for all home types combined was $732,292 – up by three per cent compared to August 2016. This growth was driven by the semi-detached, townhouse and condominium apartment market segments that continued to experience high single-digit or double digit year-over-year average price increases.
The MLS® Home Price Index composite benchmark, which accounts for typical home types throughout TREB’s market area, was up by 14.3 per cent year-over-year in August. The fact that MLS® HPI growth outstripped average price growth, points to fewer high-end home sales this year compared to last.
“The relationship between sales and listings in the marketplace today suggests a balanced market. If current conditions are sustained over the coming months, we would expect to see year-over-year price growth normalize slightly above the rate of inflation. However, if some buyers move from the sidelines back into the marketplace, as TREB consumer research suggests may happen, an acceleration in price growth could result if listings remain at current levels,” said Jason Mercer, TREB’s Director of Market Analysis.
But that is only a snapshot of what happened in the GTA. If you are looking for Etobicoke Real Estate Home Sale stats for your local area, I have you covered.
Here is a snapshot of homes sold in the month of August for Etobicoke:
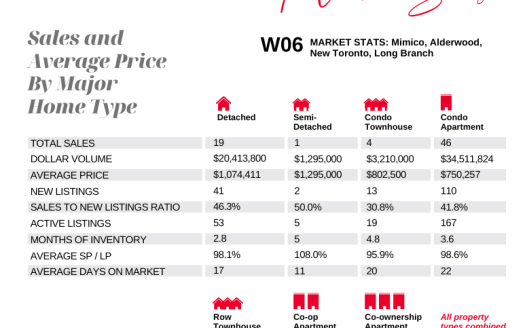
ETOBICOKE REAL ESTATE MARKET WATCH
| District | Active | Sold/Month | Sold/Year | Average$/Month |
|---|---|---|---|---|
| Area Total: | 455 | 277 | 2766 | |
| W06 | 204 | 130 | 1239 | $594,078 |
| W07 | 30 | 17 | 199 | $873,618 |
| W08 | 221 | 130 | 1328 | $665,567 |
How did your Etobicoke market do? Do you have questions about your Etobicoke home and wonder where it falls within theses stats?
For more detailed information on your Etobicoke neighbourhood or more specifically on your own home. I invite you to give me a call at 416-762-8255 or e-mail me today
PART OF MY JOB AS YOUR REALTOR® IS TO PROVIDE YOU WITH UP TO DATE LOCAL MARKET STATISTICS. THIS WAY YOU ARE KEPT IN THE KNOW ABOUT YOUR HOME’S WORTH.
THIS INFORMATION IS CRITICAL FOR MAKING A DECISION IF YOU ARE THINKING ABOUT WHETHER NOW IS A GOOD TIME TO SELL, BUY OR JUST ENJOY YOUR HOME FOR MANY YEARS TO COME!