Toronto and Etobicoke Real Estate Home Sales for November 2018

Looking for current information on Toronto and Etobicoke Real Estate Home Sales for this past November 2018? Here are the latest numbers for Home Sales in Toronto and Etobicoke.
GTA REALTORS® Release November Sold Statistics
Toronto Real Estate Board President Garry Bhaura announced the continuation of moderate price growth in November 2018 compared to November 2017. The MLS® Home Price Index (HPI) Composite Benchmark was up by 2.7% year-over-year. The average selling price was up by 3.5% year-over-year to $788,345.
Greater Toronto Area REALTORS® reported 6,251 residential transactions through TREB’s MLS® System in November 2018. This result was down by 14.7% compared to November 2017, when we saw a temporary upward shift in demand as the market was distorted by the looming OSFI-mandated stress test at the end of last year.
“New listings were actually down more than sales on a year-over-year basis in November. This suggests that, in many neighbourhoods, competition between buyers may have increased. Relatively tight market conditions over the past few months have provided the foundation for renewed price growth,” said Mr. Bhaura.
On a preliminary seasonally adjusted basis, sales were down by 3.4% compared to October 2018. The average selling price after preliminary seasonal adjustment was down by 0.8% compared to October 2018.
“Home types with lower average price points have been associated with stronger rates of price growth over the past few months. Given the impact of the OSFI-mandated mortgage stress test and higher borrowing costs on affordability, it makes sense that the condo apartment and semi-detached market segments experienced relatively stronger rates of price growth in November, as market conditions in these segments remained tight or tightened respectively over the past year,” said Jason Mercer, TREB’s Director of Market Analysis.
But that is only a snapshot of what happened in the GTA. If you are looking for Etobicoke Real Estate Home Sales for your local area, I have you covered.
Here is a snapshot of homes sold in Etobicoke for the month of November:
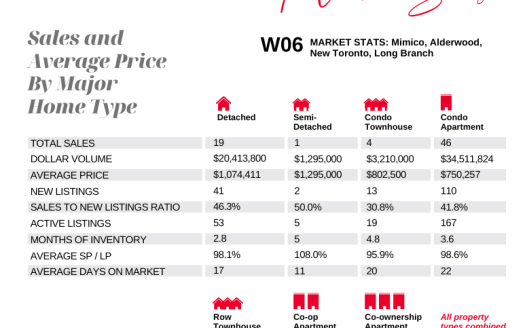
ETOBICOKE REAL ESTATE MARKET WATCH
| District | Active | Sold/Month | Sold/Year | Average$/Month |
|---|---|---|---|---|
| Area Total: | 528 | 275 | 3053 | |
| W06 | 264 | 124 | 1366 | $6731,947 |
| W07 | 30 | 23 | 278 | $1,329,100 |
| W08 | 234 | 128 | 1409 | $815,626 |
How did your Etobicoke market do? Do you have questions about your Etobicoke home and wonder where it falls within theses stats?
For more detailed information on your Etobicoke neighbourhood or more specifically on your own home. I invite you to give me a call at 416-762-8255 or e-mail me today
Part of my job as your Realtor® is to provide you with up to date local market statistics. This way, you are kept in the know about your home’s worth.
THIS INFORMATION IS CRITICAL FOR MAKING A DECISION IF YOU ARE THINKING ABOUT WHETHER NOW IS A GOOD TIME TO SELL, BUY OR JUST ENJOY YOUR HOME FOR MANY YEARS TO COME!
Please let me know how I can answer any of your real estate questions today.