Toronto and Etobicoke Real Estate Homes Sales for October 2017

Looking for current information on Toronto and Etobicoke Real Estate Home Sales for October 2017?
GTA REALTORS® Release October Stats
Toronto Real Estate Board President Tim Syrianos reported 7,118 residential sales through TREB’s MLS® System in October 2017. This result represented an above-average increase between September and October of almost 12% pointing to stronger fall market conditions.
On a year-over-year basis, October sales were down compared to 9,715 transactions in September 2016. Total sales reported through the first 10 months of 2017 amounted to 80,198 – down from 99,233 for the same time period in 2016.
“Every year we generally see a jump in sales between September and October. However, this year that increase was more pronounced than usual compared to the previous ten years. So, while the number of transactions was still down relative to last year’s record pace, it certainly does appear that sales momentum is picking up,” said Mr. Syrianos.
The MLS® Home Price Index Composite benchmark price was up by 9.7 per cent on a year-over-year basis in October. Annual rates of price growth were strongest for townhouses and condominium apartments. The average selling price for October transactions was $780,104 – up by 2.3% compared to the average of $762,691 in October 2016.
“The housing market in the GTA has been impacted by a number of policy changes at the provincial and federal levels. Similar to the track followed in the Greater Vancouver Area, it appears that the psychological impact of the Fair Housing Plan, including the tax on foreign buyers, is starting to unwind,” said Jason Mercer, TREB’s Director of Market Analysis.
But that is only a snapshot of what happened in the GTA. If you are looking for Etobicoke Real Estate Home Sale stats for your local area, I have you covered.
Here is a snapshot of homes sold in the month of October for Etobicoke:
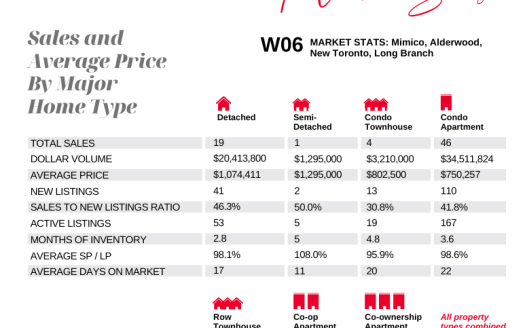
ETOBICOKE REAL ESTATE MARKET WATCH
| District | Active | Sold/Month | Sold/Year | Average$/Month |
|---|---|---|---|---|
| Area Total: | 570 | 290 | 3304 | |
| W06 | 239 | 127 | 1477 | $647,818 |
| W07 | 51 | 22 | 237 | $1,312,459 |
| W08 | 280 | 141 | 1590 | $943,649 |
How did your Etobicoke market do? Do you have questions about your Etobicoke home and wonder where it falls within theses stats?
For more detailed information on your Etobicoke neighbourhood or more specifically on your own home. I invite you to give me a call at 416-762-8255 or e-mail me today
PART OF MY JOB AS YOUR REALTOR® IS TO PROVIDE YOU WITH UP TO DATE LOCAL MARKET STATISTICS. THIS WAY YOU ARE KEPT IN THE KNOW ABOUT YOUR HOME’S WORTH.
THIS INFORMATION IS CRITICAL FOR MAKING A DECISION IF YOU ARE THINKING ABOUT WHETHER NOW IS A GOOD TIME TO SELL, BUY OR JUST ENJOY YOUR HOME FOR MANY YEARS TO COME!