Toronto and Etobicoke Real Estate Home Sales for September 2018

Looking for current information on Toronto and Etobicoke Real Estate Home Sales for this past September 2018? Here are the latest numbers for Home Sales in Toronto and Etobicoke.
GTA REALTORS® Release September Sold Statistics
Toronto Real Estate Board President Garry Bhaura announced that Greater Toronto Area REALTORS® reported 6,455 sales through TREB’s MLS® System in September 2018 – up 1.9% compared to September 2017. The average selling price for September 2018 sales was up by 2.9% over the same period to $796,786. The MLS® HPI composite benchmark price was up by 2% year-over-year.
New listings entered into TREB’s MLS® System in September 2018 amounted to 15,920 – down by 3.1% compared to September 2017. With sales up year-over-year and new listings down, market conditions became tighter. Many buyers may have found it more difficult to find a home meeting their needs.
“It is healthy to see sales and prices in many areas across the Greater Toronto Area up a bit, compared to last year’s lows. At the same, however, it is important to remember that TREB’s market area is made up of over 500 communities. Market conditions have obviously unfolded differently across these communities. This is why it’s important to work with a REALTOR® who is familiar with local market conditions in your areas of interest,” said Mr. Bhaura.
“While higher borrowing costs and tougher mortgage qualification rules have kept sales levels off the record pace set in 2016, many households remain positive about home ownership as a quality long-term investment. As the GTA population continues to grow, the real challenge in the housing market will be supply rather than demand. The Toronto Real Estate Board is especially concerned with issues affecting housing supply as we move towards municipal elections across the region,” added Mr. Bhaura.
On a monthly basis, after preliminary seasonal adjustment, sales edged up by 0.2% in September 2018 compared to August 2018. The average selling price, after preliminary seasonal adjustment, edged lower by 0.5% month-over-month.
“Generally speaking, annual rates of price growth have been stronger for higher density home types in 2018, including condominium apartments, townhouses and semi-detached houses. In many neighbourhoods, these home types provide more affordable home ownership options. This is why a policy focus on increasing mid-density housing options throughout the GTA is important,” said Jason Mercer, TREB’s Director of Market Analysis.
But that is only a snapshot of what happened in the GTA. If you are looking for Etobicoke Real Estate Home Sales for your local area, I have you covered.
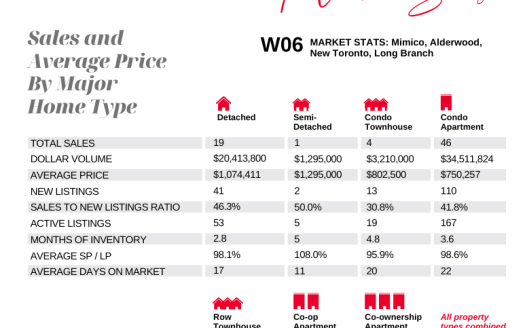
Here is a snapshot of homes sold in Etobicoke for the month of September:
ETOBICOKE REAL ESTATE MARKET WATCH
| District | Active | Sold/Month | Sold/Year | Average$/Month |
|---|---|---|---|---|
| Area Total: | 579 | 266 | 2441 | |
| W06 | 248 | 124 | 1100 | $741,785 |
| W07 | 38 | 22 | 221 | $1,411,230 |
| W08 | 293 | 120 | 1120 | $932,891 |
How did your Etobicoke market do? Do you have questions about your Etobicoke home and wonder where it falls within theses stats?
For more detailed information on your Etobicoke neighbourhood or more specifically on your own home. I invite you to give me a call at 416-762-8255 or e-mail me today
Part of my job as your Realtor® is to provide you with up to date local market statistics. This way, you are kept in the know about your home’s worth.
THIS INFORMATION IS CRITICAL FOR MAKING A DECISION IF YOU ARE THINKING ABOUT WHETHER NOW IS A GOOD TIME TO SELL, BUY OR JUST ENJOY YOUR HOME FOR MANY YEARS TO COME!
Please let me know how I can answer any of your real estate questions today.